In this benchmark, I did nothing with Laravel itself, I'm just want to see the different behaviors of the different optimization ways.
First of all, I'd like to put the conclusion here. The OPcache is a good choice to speed up your PHP project. From the two pics below, it seems like I didn't get the advantage of PHP PM, maybe it was limited by my Docker memory configuration. Anyway, the response latency of PHP PM is very impressive, 98% of requests are within 84ms.
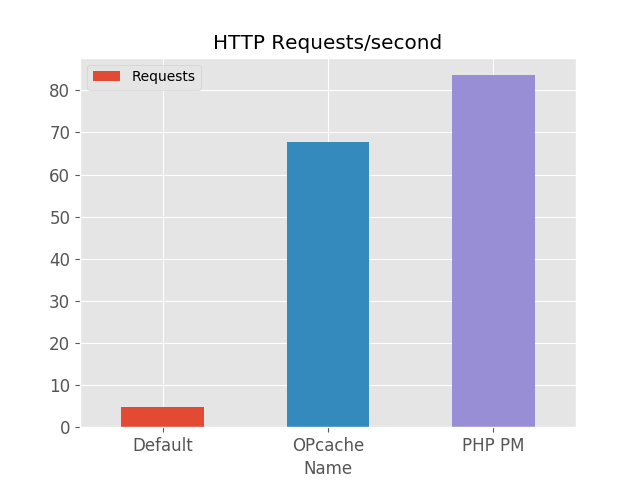
Complete Requests per Second
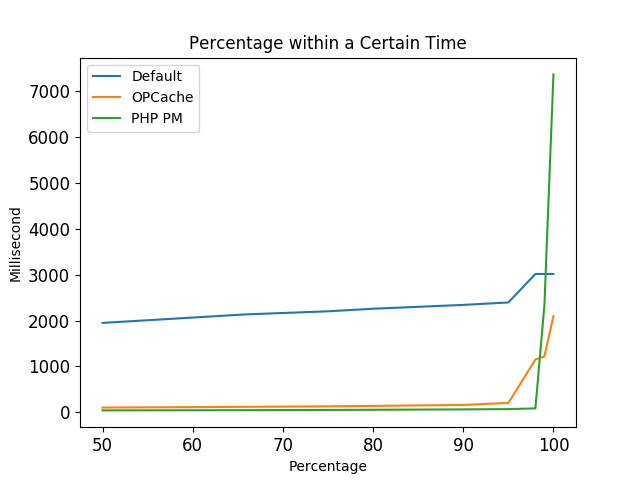
Percentage of the Requests Served within a Certain Time (ms)
The first is round of this benchmark, I just pulled down the Laravel code from Github and run the cache commands.
The second round followed this post from Taylor Otwell. It will tell you about the how and why questions of Laravel benchmark.
For the last one, PPM, it's a concurrency framework based on ReactPHP. As an event-driven framework is different from the way of how I used to construct my code.
Benchmark command line:
ab -t 10 -c 10 http://test.vagrant/Default Settings
➜  ~ ab -t 10 -c 10 http://test.vagrant/
This is ApacheBench, Version 2.3 <$Revision: 1757674 $>
Copyright 1996 Adam Twiss, Zeus Technology Ltd, http://www.zeustech.net/
Licensed to The Apache Software Foundation, http://www.apache.org/

Benchmarking test.vagrant (be patient)
Finished 47 requests

Server Software:        Apache/2.4.10
Server Hostname:        test.vagrant
Server Port:            80

Document Path:          /
Document Length:        2321 bytes

Concurrency Level:      10
Time taken for tests:   10.035 seconds
Complete requests:      47
Failed requests:        0
Total transferred:      157750 bytes
HTML transferred:       109087 bytes
Requests per second:    4.68 [#/sec] (mean)
Time per request:       2135.081 [ms] (mean)
Time per request:       213.508 [ms] (mean, across all concurrent requests)
Transfer rate:          15.35 [Kbytes/sec] received

Connection Times (ms)
              min  mean[+/-sd] median   max
Connect:        0    0   0.0      0       0
Processing:  1324 1988 313.9   1973    3017
Waiting:     1324 1988 313.9   1973    3017
Total:       1324 1989 313.9   1973    3017

Percentage of the requests served within a certain time (ms)
  50%   1949
  66%   2136
  75%   2202
  80%   2258
  90%   2342
  95%   2395
  98%   3017
  99%   3017
 100%   3017 (longest request)
With OPcache optimized
➜  source ab -t 10 -c 10 http://test.vagrant/
This is ApacheBench, Version 2.3 <$Revision: 1757674 $>
Copyright 1996 Adam Twiss, Zeus Technology Ltd, http://www.zeustech.net/
Licensed to The Apache Software Foundation, http://www.apache.org/

Benchmarking test.vagrant (be patient)
Finished 678 requests

Server Software:        Apache/2.4.10
Server Hostname:        test.vagrant
Server Port:            80

Document Path:          /
Document Length:        2321 bytes

Concurrency Level:      10
Time taken for tests:   10.020 seconds
Complete requests:      678
Failed requests:        0
Total transferred:      2275602 bytes
HTML transferred:       1573638 bytes
Requests per second:    67.66 [#/sec] (mean)
Time per request:       147.788 [ms] (mean)
Time per request:       14.779 [ms] (mean, across all concurrent requests)
Transfer rate:          221.78 [Kbytes/sec] received

Connection Times (ms)
              min  mean[+/-sd] median   max
Connect:        0    0   0.1      0       1
Processing:    45  140 208.3    102    2097
Waiting:       45  140 208.4    102    2097
Total:         46  140 208.3    102    2097

Percentage of the requests served within a certain time (ms)
  50%    102
  66%    118
  75%    129
  80%    138
  90%    159
  95%    203
  98%   1151
  99%   1219
 100%   2097 (longest request)
PHP PM
➜  ~ ab -t 10 -c 10 http://test.vagrant/
This is ApacheBench, Version 2.3 <$Revision: 1757674 $>
Copyright 1996 Adam Twiss, Zeus Technology Ltd, http://www.zeustech.net/
Licensed to The Apache Software Foundation, http://www.apache.org/

Benchmarking test.vagrant (be patient)
Finished 836 requests

Server Software:        nginx/1.12.2
Server Hostname:        test.vagrant
Server Port:            80

Document Path:          /
Document Length:        2321 bytes

Concurrency Level:      10
Time taken for tests:   10.001 seconds
Complete requests:      836
Failed requests:        0
Total transferred:      3343384 bytes
HTML transferred:       1940356 bytes
Requests per second:    83.59 [#/sec] (mean)
Time per request:       119.629 [ms] (mean)
Time per request:       11.963 [ms] (mean, across all concurrent requests)
Transfer rate:          326.47 [Kbytes/sec] received

Connection Times (ms)
              min  mean[+/-sd] median   max
Connect:        0    0   0.1      0       1
Processing:    16  102 603.2     40    7371
Waiting:       16  101 603.2     40    7370
Total:         17  102 603.2     40    7371

Percentage of the requests served within a certain time (ms)
  50%     40
  66%     45
  75%     50
  80%     54
  90%     62
  95%     68
  98%     84
  99%   2341
 100%   7371 (longest request)